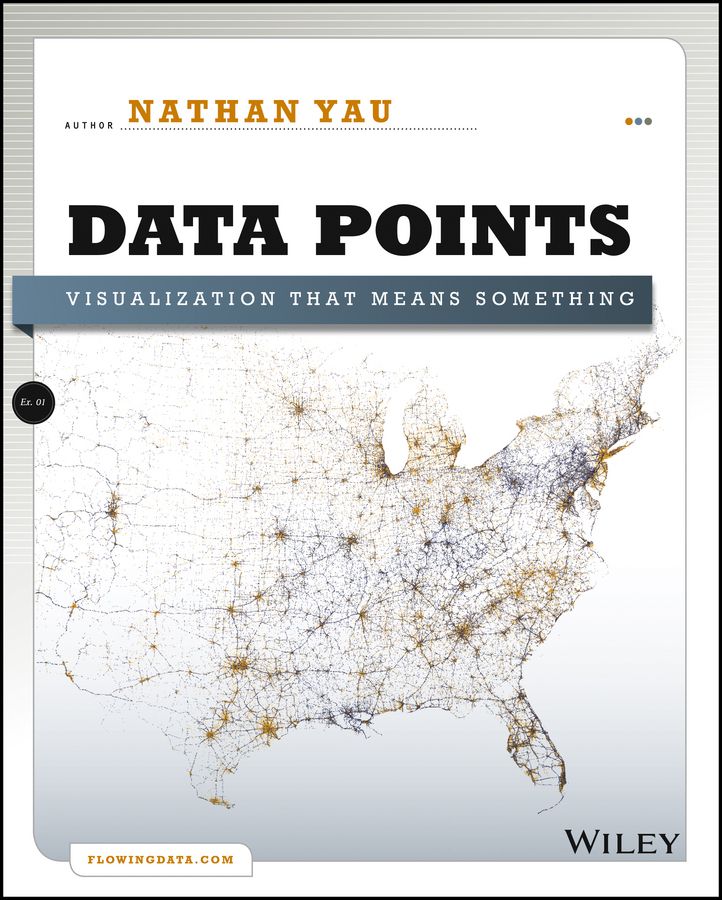
<p><b>A fresh look at visualization from the author of <i>Visualize This</i></b></p> <p>Whether it’s statistical charts, geographic maps, or the snappy graphical statistics you see on your favorite news sites, the art of data graphics or visualization is fast becoming a movement of its own. In <i>Data Points: Visualization That Means Something</i>, author Nathan Yau presents an intriguing complement to his bestseller <i>Visualize This</i>, this time focusing on the graphics side of data analysis. Using examples from art, design, business, statistics, cartography, and online media, he explores both standard-and not so standard-concepts and ideas about illustrating data.</p> <ul> <li>Shares intriguing ideas from Nathan Yau, author of <i>Visualize This</i> and creator of flowingdata.com, with over 66,000 subscribers</li> <li>Focuses on visualization, data graphics that help viewers see trends and patterns they might not otherwise see in a table</li> <li>Includes examples from the author’s own illustrations, as well as from professionals in statistics, art, design, business, computer science, cartography, and more</li> <li>Examines standard rules across all visualization applications, then explores when and where you can break those rules</li> </ul> <p>Create visualizations that register at all levels, with <i>Data Points: Visualization That Means Something</i>.</p>
Business applications
Data Points
₹2,827.00
Visualization That Means Something
This book is currently not in stock. You are pre-ordering this book.

